

How often do you monitor and react to the revenue trends? Are you keeping pace with regular changes in the market? From one day to another, revenue drivers may vary for numerous reasons such as:
- New budgets in the market
- Buyers that stop spending for a given advertiser or start buying deals for new brands
- Bidders that transfer their budget from one SSP to another (so called “Supply-Path Optimization” or “cheap routes”)
To be frank, keeping track of all these real-time changes is a pain in the neck.
Simply put, you are missing out on
potential revenue streams.
Quantifying the impacts of changes in your stack, GDPR ramping up, seasonal evolutions, real-time changes in the market and knowing how to react quickly costs your team a lot of time and resources, which could be put to better use.
Here, we’ll discuss how to use data effectively, detect trends and react accordingly, but if you want to learn more about Adomik:
Monitor Changes Across Your Stack
Either you’re a publisher or a network, your real-time data is an advantage if you monitor it timely and take actions accordingly.
Before you’re able to run any analyses, you or your team need to extract the numbers from different sources, and join them in a smart manner to get a picture of each buyer’s spend and consequently compare CPMs and impressions across your different monetization channels.
Pulling and putting data together is the top challenge.
Data aggregation can take hours or days. One of the challenges you may have faced during these analyses is that some dimensions (e.g. buyers, brands, publishers, etc.) are not identified similarly across different platforms.
Here’s how you’d normally do it
A very common strategy is to export various reports from GAM, AppNexus, Criteo, Improve, Index Exchange, and any other platforms. Then, you probably combine, aggregate and then try and map the data in order to get a perspective on each and every buyer (take the buyer Vivaki as an example below).

To be able to compare and detect changes, you need to pull out data on different buyers. Doing the same homework for all buyers could take you at least half a day (generously speaking!). Not even talking about advertisers… And what about maintenance?!
How you should be doing it (with Report)
To continue with our example of Vivaki, using the Adomik reporting product, Report, all you have to do is to filter a buyer and then apply the mapping to get a comprehensive look of the buyer’s spend.
All this takes you about… 30 seconds.

Now, you can spend the rest of your free time deep-diving (literally!).
You can save time aggregating and shaping data from each partner and start capturing opportunities on a daily basis.
Anticipate Your Revenue Trends
Now that you have a unified dataset ready, you can actually start digging for trends that impact your revenue.
Step 1 | Choose the appropriate time period to get a perspective of your stack.
The Report calendar allows you to get a granular, daily outlook on your stack to detect changes or a comprehensive perspective by comparing different quarters. If you’re looking to monitor new campaigns and measure recent changes, it’s best to look at a week or so to have recent information. For example, monitoring new changes started in October compared to the end of September would help you anticipate the rest of the month.

For the selected period, you’re able to visualize variations between monetization partners (ad server, SSPs) and even break them down into different categories (e.g. monetization channels (open auction, PMP, guaranteed), publishers, etc.), all mapped across your whole stack. This gives you an overall view of major trends before your next deep-dive.
Step 2 | Detect changes among your monetization partners
Comparing monetization partners, you can easily detect which partners have been decreasing their spend on your inventory and further investigate by clicking on it.

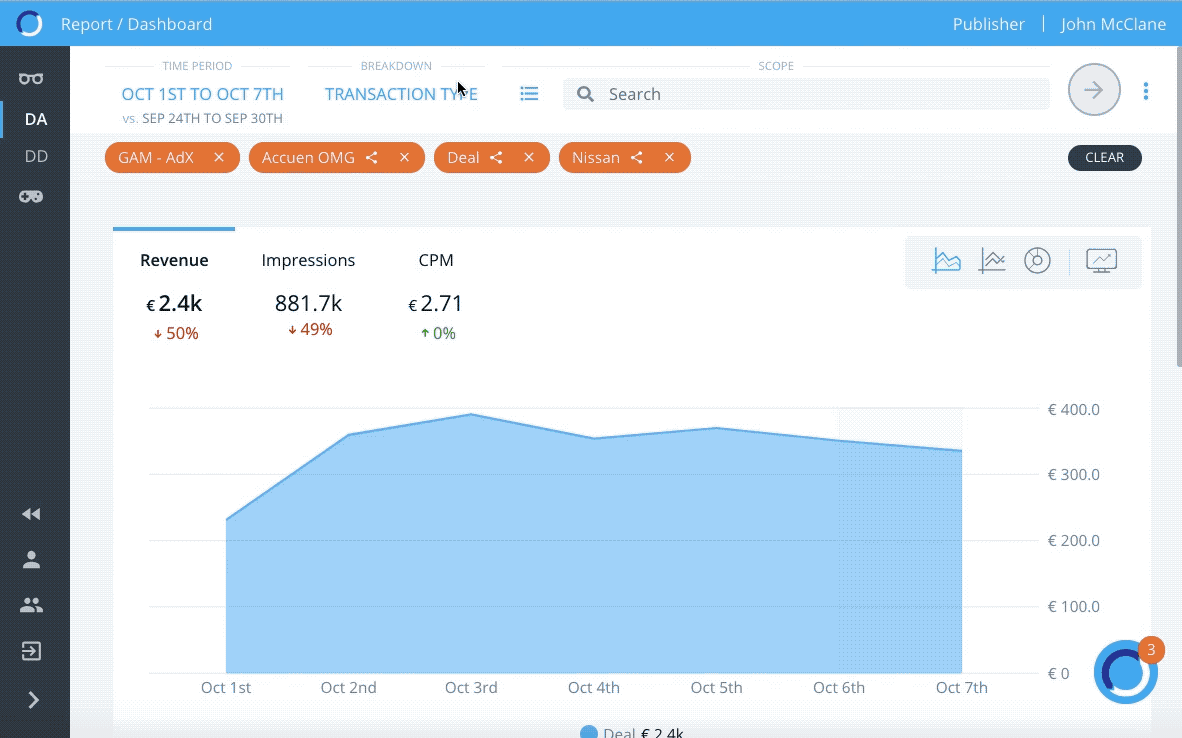
Let’s check on the second biggest revenue driver (GAM – Google AdX) and see why it has been lowering its spend compared to the previous month and if there’s anything you could do on your side to prevent this dropping further.
Step 3 | Among your top buyers, find which ones would have the greatest impact on your revenue.
Next, you can break down your report and look at the “Revenue Comparison” for your top buyers to monitor changes in revenue compared to the last period that you have selected. See the breakdown by transaction types and find out the significant revenue changes.
.gif)
Take Accuen OMG, it has decreased its spend by 43% in the first week of October on all the transaction types (Open Auction, Deal and First Look). But it’s not enough to know which buyer has dropped its spend without having any details. Click to filter on this buyer to dig deeper and discover reasons behind the drop.
Step 4 | Find out which brands are contributing to the revenue drop for the buyer you’ve tracked.
Breaking down the results step by step, you can understand which are the main drivers behind Accuen OMG’s collapse on GAM-Google AdX. By screening through top campaigns, we can see that Nissan is the top “contributor” leading to this drop.

Step 5 | Identify the parts of your inventory impacted by this negative trend
No longer will your inventory be a black box. Report enables identifying the parts of your inventory impacted by a change in demand.

Looking at formats above, the revenue drop on Google AdX is mainly due to a decrease in Accuen OMG spend on half-page (300×600) and mobile banner 320×250 for Nissan.
Step 6 | Your deep-dive will not stop here!
Depending on your goal, you can dive deeper on Report to find out information on that could not be accessible otherwise.

React to the changes and don’t leave money on the table
How can you turn trends into opportunities?
In order to identify the greatest and best streams of demand, opportunity costs, to have visibility on your inventory and to be able to anticipate the campaign and buyer’s next moves, you need to leverage real-time data and react accordingly. Having detailed monitoring across all your stack and unified analytics on your inventory and demand ecosystems are essential to the success and efficiency of your sales, yield, ad ops and revenue teams.
Now that you have identified the revenue changes thanks to Report, you can follow up by learning about the real causes behind these trends by:
- Contacting the buyer directly to understand if there’s any problem on their end, and providing them with granular, actionable analytics.
- Checking if the issue is actually bidder-wide, by using Report unified “bidder” dimension In that scenario, you could contact the DSP directly to troubleshoot.
Using Adomik’s market intelligence and benchmarking tool, Sell, you could finally answer the question “is this trend normal?”, and adjust your sales or yield efforts accordingly. If you want to learn more about Adomik: